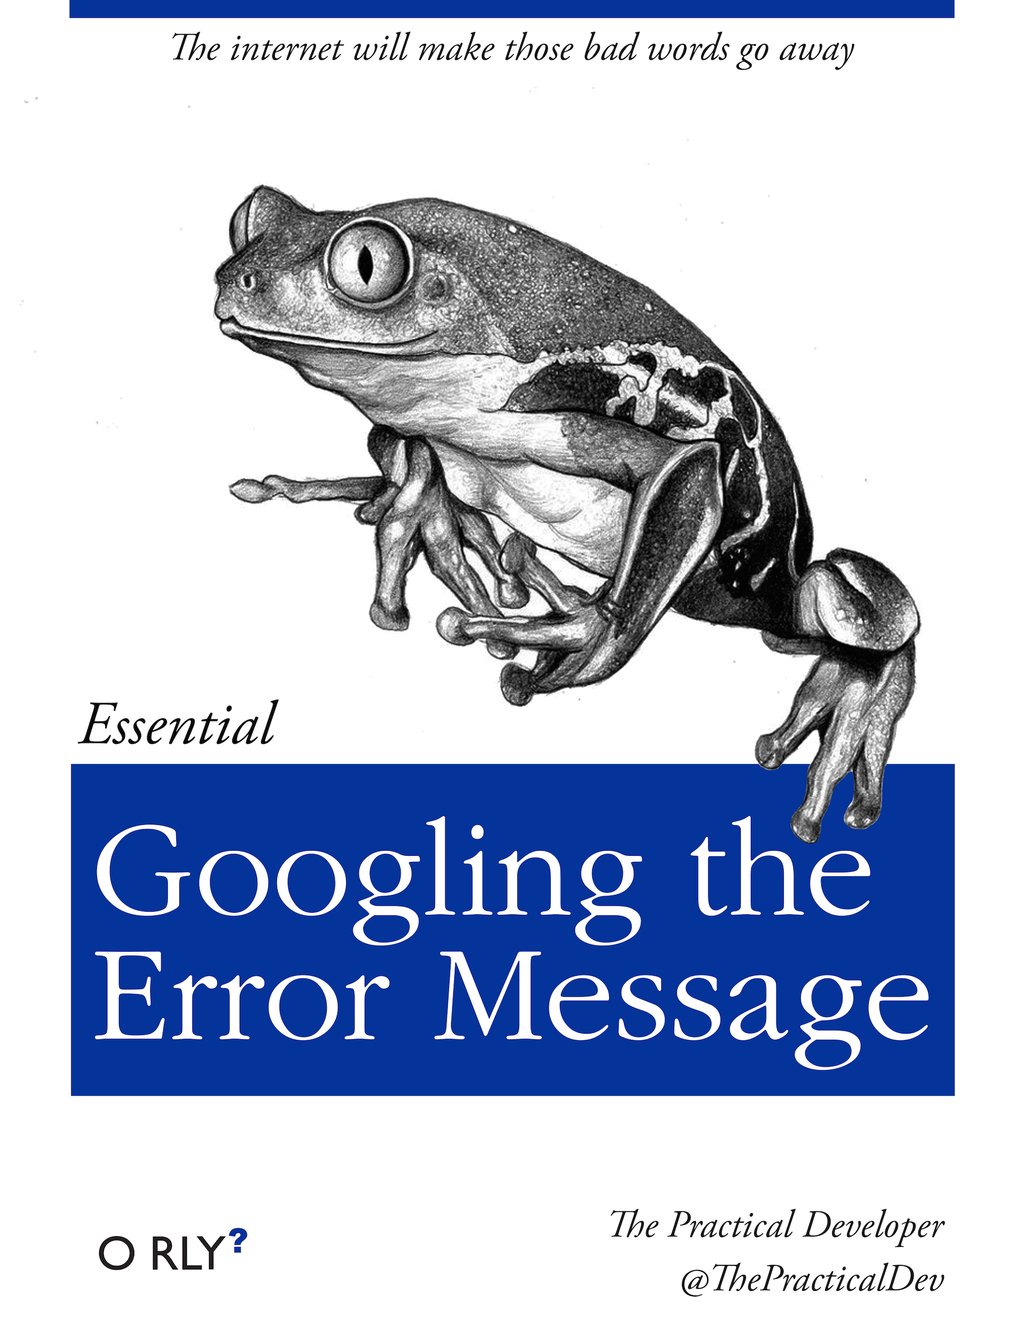
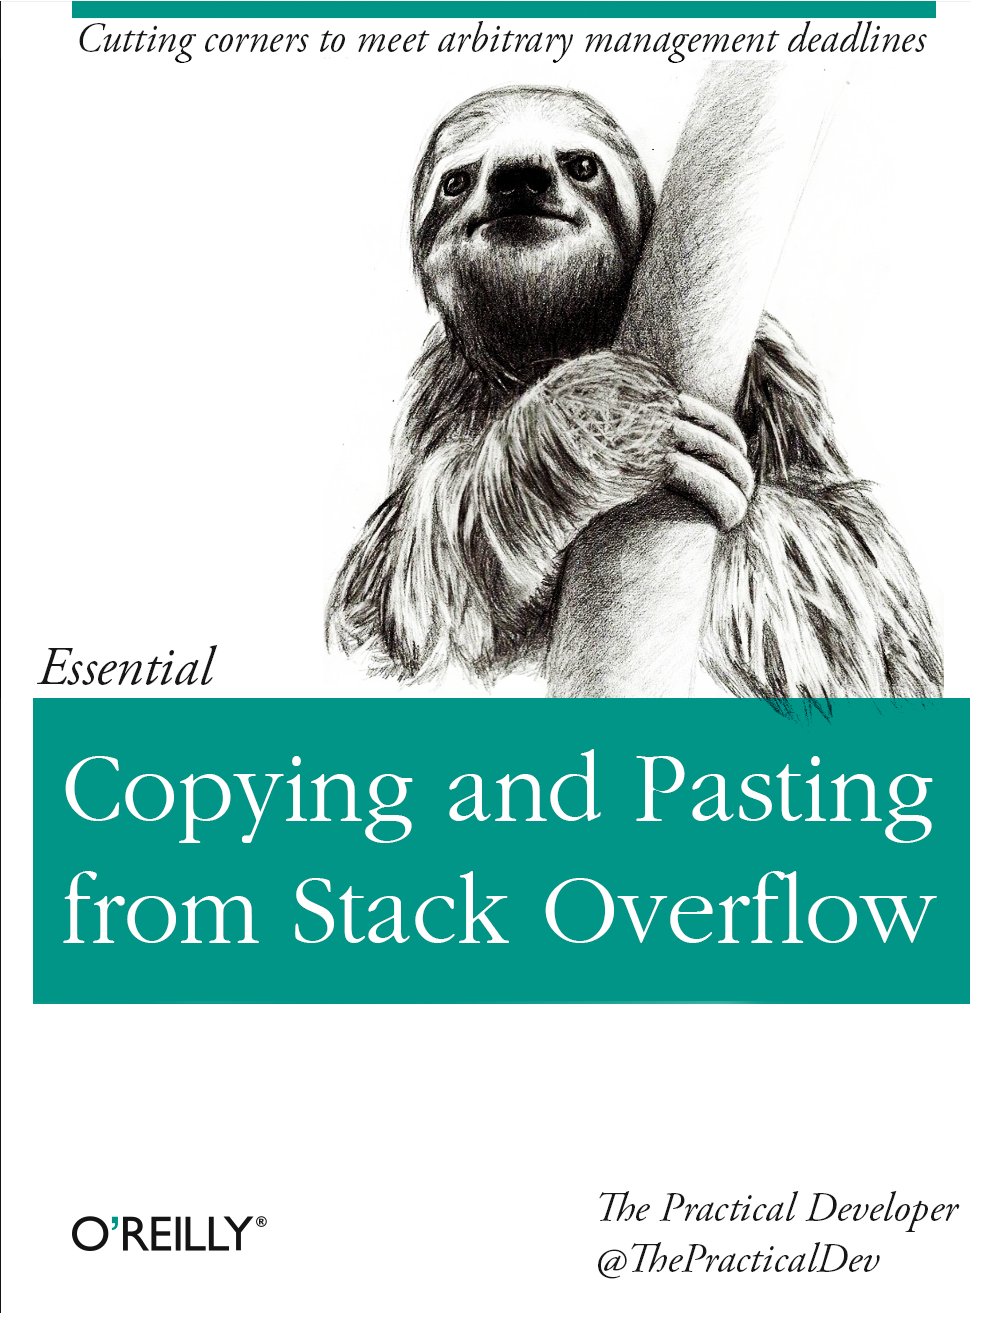
class: center, middle, inverse, title-slide # Sciences Po - R - Beginner ### Sylvain Lapoix, Datactivist ### Sciences Po, 21-22 janvier 2019 --- layout: true <div class='my-footer'><span>R - Beginner / 21-22/01/2019</span> <center><div class=logo><img src='https://github.com/datactivist/slides_datactivist/raw/master/inst/rmarkdown/templates/xaringan/resources/img/fond_noir_monochrome.png' width='100px'></center></span></div> --- class: center, middle Ces slides en ligne : http://datactivist.coop/lagrosseconf Sources : https://github.com/datactivist/lagrosseconf Les productions de Datactivist sont librement réutilisables selon les termes de la licence [Creative Commons 4.0 BY-SA](https://creativecommons.org/licenses/by-sa/4.0/legalcode.fr). <BR> <BR>  --- # Disclaimer : my moto > There are no silly questions. -- > There's only awkward silences. --- class: inverse, center, middle # 1 - The gear --- ## Why R ? R is a powerful, versatile and still improving programmation language designed by and for daily data users. -- It benefits from several keys components that make it incredibly handy : * a deep and **easy-to-find documentation** ; * a broad spectrum of **extensions and packages to fit any needs** (this presentation is entirely made in R) ; * a huge **connectivity** with other techs and tools (APIs, other languages such as Python, SQL or Javascript, etc.) ; * a **large and friendly community** ; * and it's **open source**, come on ! -- And for your specific need as .red[**policy analysts**], using R instead of Excel or (worse) Numbers means : * better tools ; * easier to share ; * simple to reproduce. --- background-image: url(https://media.giphy.com/media/Ae7SI3LoPYj8Q/giphy.gif) class: center, top ## You'll never be alone in R. --- ## Your new data hub : Rstudio As other programming langauges, R can be used in the command line (which we'll refer to as "cli" further on, for "command line interface"). But you'll benefit greatly from using a programming environnement. The one we'll choose is Rstudio. It will help you : * organize your files and data ; * keep track of your environment (we'll get back to that later) ; * solve most of common issues you'll encounter in an easier fashion. -- Plus : it has MANY resources in [its cheatsheet page](https://www.rstudio.com/resources/cheatsheets/). --- background-image: url(https://media.giphy.com/media/Gpf8A8aX2uWAg/giphy.gif) class: center, bottom ### But let's take a look around ourselves --- class: inverse, center, middle # 2 - The basics --- ## Data types You'll stumble upon 3 main types of data in R (and in computers in general) : .pull-left[1. **numeric values**, labeled "num" ; 2. **strings**, labeled "chr" for "character" ; 3. **boolean**, labele "logi" for "logical".] .pull-right[1. quantities : you can make math with ; 2. succession of character (can't do math with) ; 3. TRUE or FALSE (basically the answer to a closed question)] -- To those mains types you'll use other values for specific cases : * "NA", "#N/A" or "NaN", depending on the source, for "**not available**", describes a missing value in a dataset. **It's not "zero"** : it's a logical value that can be calculated (or evaluated) ; * "NULL" is an undefined value. It can't be evaluated and, in most cases, can't be coherced into something else. Other data types can be encountered in more advanced usage, such as geomatics ans statistics. --- ### Quick search : can you find 5 of each data type in the room ? --- ## R CLI basics The "command line interface" or CLI is just a big supercharged calculator that can do many simple operations : ```r 1+1-12*24/2 # Basic arithmetic ``` ``` ## [1] -142 ``` ```r 42 %% 5 # Modulo ``` ``` ## [1] 2 ``` But it can also handle variables, meaning it can "store" values or data structures into a name and allow you to manipulate it. We'll say that we "assign" an object to a variable. In R, we do it with an arrow<sup>*</sup> : ```r puregold <- (1+sqrt(5))/2 puregold ``` ``` ## [1] 1.618034 ``` --- ## Data structures : vectors 1 Data can be stored in different type of structures, depending on your needs or the tools you use. The **vector** is the core structure of R : * it is one dimensional ; * it is "atomic" (can contain only one type of data) ; * it is indexable (you can call any value it contains by its index). You can create a vector with the function `c()` with the values separated by commas : ```r c(4, 8, 15, 16, 23, 42) ``` ``` ## [1] 4 8 15 16 23 42 ``` --- ## Data structures : vectors 2 If you type it without any other command, it will vanish. To "store" it properly, you can "assign" it to a variable of your choice : ```r lost <- c(4, 8, 15, 16, 23, 42) ``` You can call any value with an index : ```r lost[1] ``` ``` ## [1] 4 ``` **Warning** : for those used to other languages : indexing starts at 1 in R, so 1 == 1. To select multiple values of a vector, you'll use brackets and put a vector inside of it to specify the sequence : * with comma(s) if the values aren't consecutive ; * with colon(s) if you're looking for a range. --- background-image: url(https://media.giphy.com/media/g0ShXDbLT7g4M/giphy.gif) class: inverse, center, top ### Yes : a vector within a vector --- ## Data structures : matrices A matrix is a two dimensionnal data structure that can store one type of data. You can create it with the function `matrix(values, [nrow=x, ncol=y])`. For exemple, to create a 4 by 5 matrix containing all value between 1 and 20 we'll go : ```r matrix(1:20, nrow = 4) ``` ``` ## [,1] [,2] [,3] [,4] [,5] ## [1,] 1 5 9 13 17 ## [2,] 2 6 10 14 18 ## [3,] 3 7 11 15 19 ## [4,] 4 8 12 16 20 ``` You can coherce a vector into a matrix or a variable containing a certain number of values. ```r matrix(lost, nrow=3) ``` ``` ## [,1] [,2] ## [1,] 4 16 ## [2,] 8 23 ## [3,] 15 42 ``` --- ## Data structures : data frames The go-to structure for data manipulation will be dataframes, two dimensionnal data structures that can contain different data types for each column. It's usually the data structure you'll end up with by loading an external fill. But you can make on youself by using the `data.frame()` function. To coherce several vectors together, for example. ```r found <- c(1, 2, 3, 5, 8, 13) data.frame(lost, found) ``` ``` ## lost found ## 1 4 1 ## 2 8 2 ## 3 15 3 ## 4 16 5 ## 5 23 8 ## 6 42 13 ``` You'll work with a similar type called "tibbles" in a short time. --- ## Loading a dataset From the outside, you can use : `read.csv()` for CSVs with the path to the file. *Lazy tip : if you're not used to paths, you can store the path into a variable after choosing by with the function file.choose().* For semi-colon separated values (or SCSV), you can use `read.csv2()`. But you'll encounter many other formats to handle. For text formats, we'll use `read.delim()` You can also load data from within libraries (every single has one). But well'll get to that later. Let's get into it with some ACTUAL data : [the subsidies of the city of Besançon from 2008 to 2012](https://www.data.gouv.fr/fr/datasets/subvention-besancon-2008-2012/). --- ## Getting basic informations Get a glimpse with `summary()` or `str()` Get the distribution of the values with `table()` -- Get the names with ... well, `names()` Get the length with ... OK, `length()` -- .footnote[Reminder : everything you get can be stored, manipulated, coherced and used.] --- ## Using libraries --- class: inverse, center, middle # 3 - The good practices --- ## Organize your work in scripts >“I comment my code as if at any moment I might get a traumatic brain injury”, [Mara Maverick](https://twitter.com/drob/status/987795355659112453), Rstudio. --- ## Organize your project in framework of files --- ## Know where to find answers .pull-left[  ] .pull-right[  ] --- ## Use "PATHs" ### Absolute ### Relative --- class: inverse, center, middle # 4 - The improvement --- class: inverse, center, middle # 5 - The visuals --- class: inverse, center, middle # 6 - The application --- class: inverse, center, middle # Thank you ! Contact : [sylvain@datactivist.coop](mailto:sylvain@datactivist.coop) / [@sylvainlapoix](https://twitter.com/sylvainlapoix)